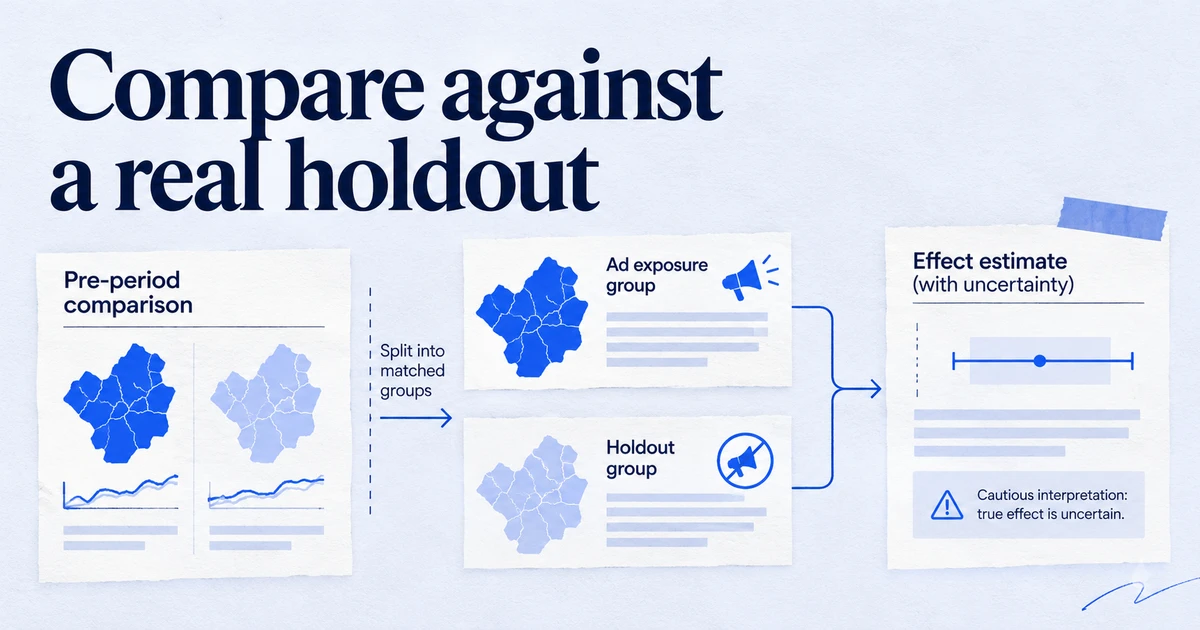
You can measure incrementality without data scientists by using the lift tools inside Google Ads and Meta, which handle the randomisation and statistics for you, or by running a simple geo holdout: pause ads in a set of regions, compare their sales with matched regions, and check the pre-period first. Google lowered the entry point in 2025 with Bayesian Conversion Lift and a 5,000 USD minimum budget for user-based studies. The hard part is not the maths but the discipline: one question, a fixed plan, and enough time.
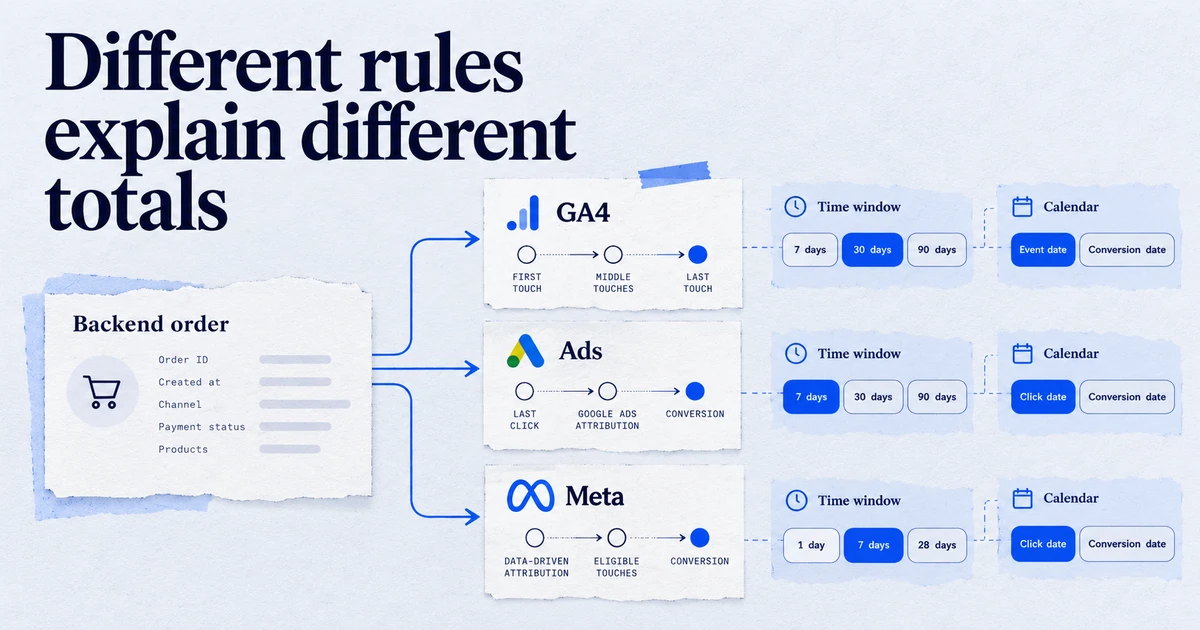
Attribution tells you which tracked conversions an ad touched. It cannot tell you how many of those sales would have happened anyway. That gap is why brand search, retargeting and Performance Max often look brilliant in their own reports and less so when someone switches them off. Incrementality tests close the gap by comparing a group exposed to your ads with a comparable group that was not. The statistics behind good tests are serious, but in 2026 you can run useful ones without a data scientist, as long as you choose the right method and keep the plan simple.
What are your options, from least to most effort?
| Method | Who does the statistics | Typical use | Main limitation |
|---|---|---|---|
| Google Ads Conversion Lift (users or geography) | Search, YouTube, Demand Gen, Performance Max | Eligibility and budget minimums; measures Google ads only | |
| Meta lift test | Meta | Meta campaigns | Measures Meta ads only, on Meta's measurement |
| Geo holdout you run yourself | You, with a spreadsheet or SQL | Any channel that can be targeted by region | Needs comparable regions and discipline |
| CRM or email holdout | You | Email, SMS, retargeting lists | Only works where you control the audience |
| Open-source geo tools (GeoLift, Trimmed Match) | You, with R or Python | Larger or repeated geo tests | Needs someone comfortable with code |
The platform tools are the easiest place to start because randomisation and analysis are done for you. Your own geo holdout is the most flexible, because it measures sales in your backend, not the platform's conversions.
What changed in Google Ads in 2025?
Google moved Conversion Lift from a frequentist to a Bayesian methodology for all Google Ads accounts in 2025. Google says the Bayesian approach uses historical campaign data, so studies can work with lower budgets and fewer conversions while increasing the chance of observing lift. Bayesian studies also support slicing results by conversion type by default, for any biddable conversion in the campaigns being tested.
Google's help page for user-based Conversion Lift currently lists these requirements:
- at least 1,000 observed conversions (conversions with supplementary data do not count);
- a minimum campaign budget of 5,000 USD for the study;
- at least one conversion action compatible with Conversion Lift.
Geography-based Conversion Lift is the alternative when user-level holdouts are not suitable. It needs a compatible conversion action (or offline data shared with your account team), and campaigns must target a single country.
Before launch, Google shows study power, its estimate of how likely the study is to detect the true effect. If power is below 90%, Google gives budget guidance to reach it. Treat that number seriously: a study with low power that finds "no significant lift" has not shown that the ads do nothing.
Google also recommends enhanced conversions for web and for leads to improve result accuracy, because they recover conversions that would otherwise go unobserved. See the enhanced conversions glossary entry.
How do Meta lift tests differ from A/B tests?
Meta's Experiments tool offers both, and they are easy to confuse. An A/B test compares two versions of an ad strategy (creative, audience, placement), and both versions deliver ads. A lift test creates a test group that can see your ads and a holdout group that is deliberately withheld from seeing them, and the difference in results between the two is the incremental lift.
For incrementality, you want a Conversion Lift test, measuring purchases or sign-ups. The same is true in Google Ads: a campaign experiment that compares two bid strategies is an A/B test, not an incrementality test.
One caveat applies to both platforms. A lift test inside Meta measures Meta's ads with Meta's conversion data, and the same applies to Google. That is fine for the question "do these ads cause conversions", but it will not tell you how much of the effect shows up in your total sales across channels.
How do you run a geo holdout yourself?
A geo holdout switches ads off (or on, or up) in some regions and leaves others unchanged. Because you measure sales in your own backend by region, it works for any channel that can be targeted by location and does not depend on cookies or consent.
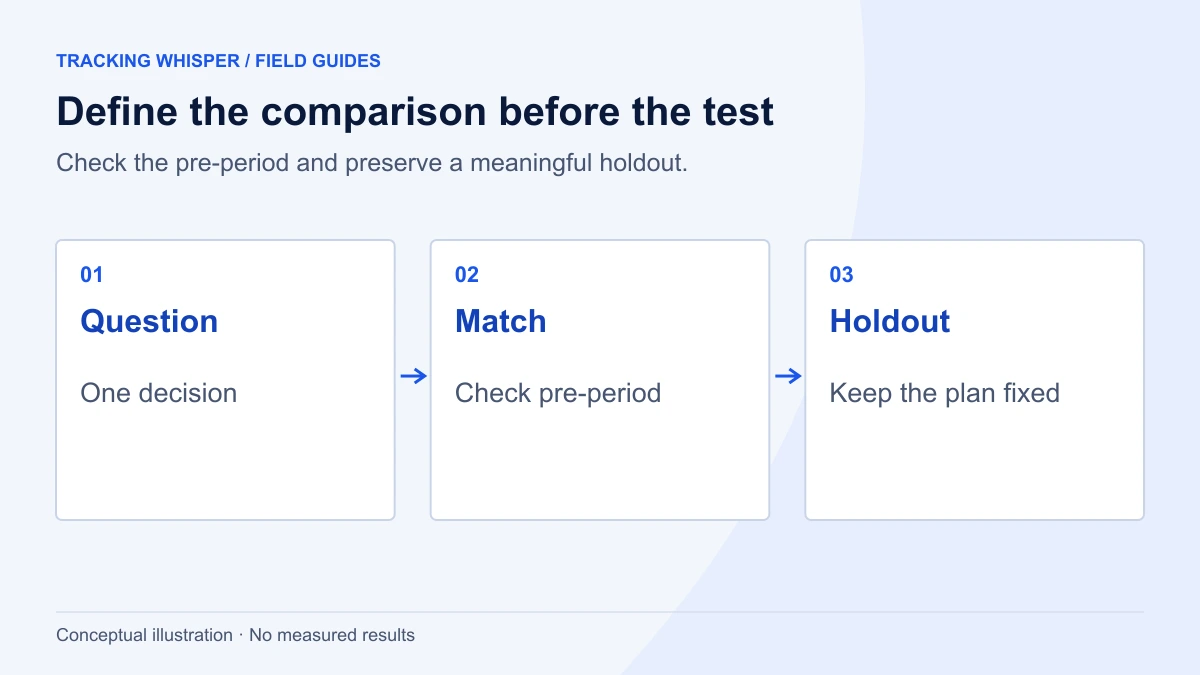
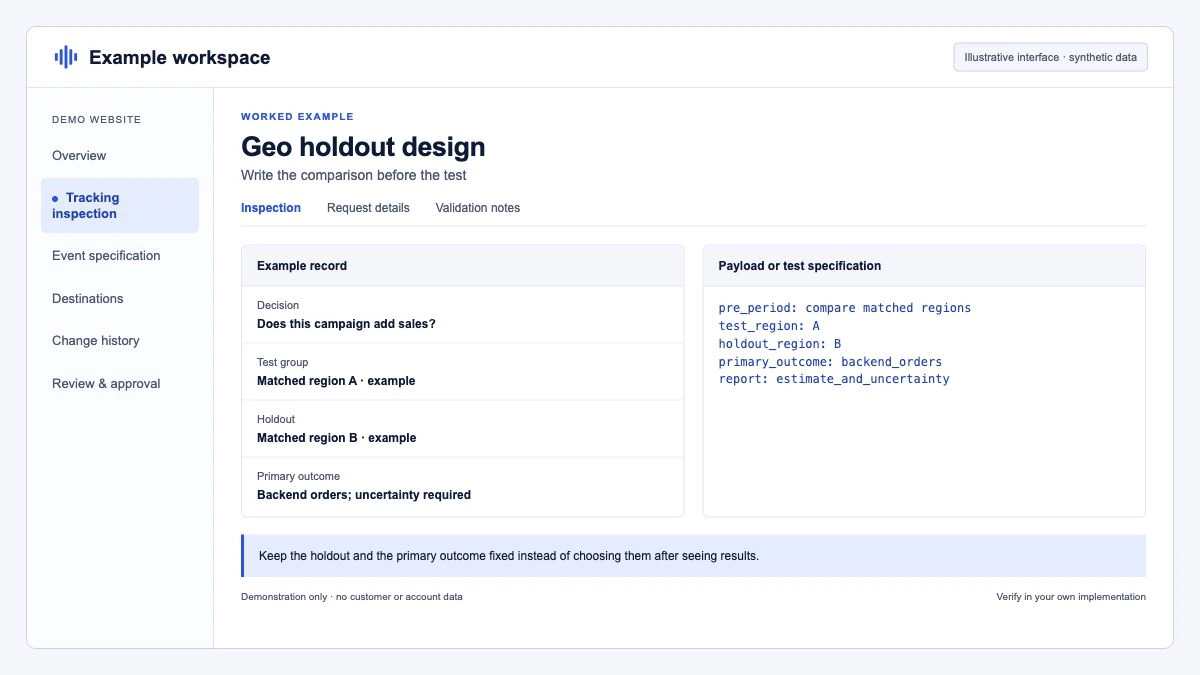
- Write down one question. For example: "What share of our online revenue in Germany would we lose without Performance Max?" One channel, one country, one metric.
- Pick the regions. Use regions large enough to have stable daily sales: states, provinces or groups of postcodes. Split them into a holdout group and a control group that look similar in size and seasonal pattern. Assign them by a coin toss within matched pairs if you can, rather than by hand-picking.
- Check the pre-period. Plot daily revenue for both groups for six to eight weeks before the test. The lines should move together. If they do not, choose different regions now, not after the test.
- Fix the plan. Write down the start date, the end date, the metric and how you will calculate the result. Share it with whoever might be tempted to stop early.
- Change only one thing. Pause the channel in the holdout regions, using location exclusions. Leave everything else, including other channels and promotions, the same in both groups.
- Run it for long enough. At least two full weeks, longer if your purchase cycle is long. Add a short cool-down after switching ads back on if the channel has delayed effects.
- Read the result once, at the end. Use the calculation you wrote down in step 4.
How do you read a geo test without statistics software?
The simplest honest analysis is a difference-in-differences: compare how much the holdout group changed from the pre-period to the test period, relative to how much the control group changed. This removes seasonality that affects both groups equally.
This BigQuery query does exactly that from an orders table with a region column. Replace the region list, dates and table name with your own.
WITH daily AS (
  SELECT
    region,
    DATE(created_at) AS day,
    SUM(net_revenue) AS revenue
  FROM `your-project.shop.orders`
  WHERE DATE(created_at) BETWEEN '2026-07-20' AND '2026-10-04'
    AND status != 'cancelled'
  GROUP BY region, day
),
labelled AS (
  SELECT
    IF(region IN ('Bayern', 'Hessen', 'Sachsen', 'Bremen'), 'holdout', 'control') AS grp,
    IF(day >= '2026-09-14', 'test', 'pre') AS period,
    day,
    revenue
  FROM daily
),
agg AS (
  SELECT
    grp,
    period,
    SUM(revenue) / COUNT(DISTINCT day) AS revenue_per_day
  FROM labelled
  GROUP BY grp, period
)
SELECT
  MAX(IF(grp = 'holdout' AND period = 'test', revenue_per_day, NULL))
    / MAX(IF(grp = 'holdout' AND period = 'pre', revenue_per_day, NULL)) AS holdout_change,
  MAX(IF(grp = 'control' AND period = 'test', revenue_per_day, NULL))
    / MAX(IF(grp = 'control' AND period = 'pre', revenue_per_day, NULL)) AS control_change,
  SAFE_DIVIDE(
    MAX(IF(grp = 'holdout' AND period = 'test', revenue_per_day, NULL))
      / MAX(IF(grp = 'holdout' AND period = 'pre', revenue_per_day, NULL)),
    MAX(IF(grp = 'control' AND period = 'test', revenue_per_day, NULL))
      / MAX(IF(grp = 'control' AND period = 'pre', revenue_per_day, NULL))
  ) - 1 AS relative_effect_in_holdout
FROM agg;
If relative_effect_in_holdout is -0.08, revenue in the holdout regions fell about 8% more than in the control regions after the ads were paused. That is your estimate of the share of revenue the channel was causing there.
Before trusting it, run the same query with the test period moved into the pre-period, a placebo test where nothing changed. If the placebo also shows a gap of several percent, the regions are too noisy to detect an effect of that size, and the real result should be treated as inconclusive.
When should you use GeoLift or Trimmed Match?
If you plan to run geo tests regularly, the open-source tools are worth the setup. Meta's GeoLift is an R package that uses synthetic control methods and includes power calculators for choosing test markets, plus multi-cell tests. Google's Trimmed Match is a Python library (with a C++ core) for designing and analysing randomised paired geo experiments; Google labels it a research project, not an officially supported product. Both expect someone comfortable with R or Python, but not necessarily a statistician.
Results from these tests are also the best input for calibrating a marketing mix model. See marketing mix modelling for mid-size budgets.
What mistakes ruin most tests?
- Testing the wrong metric. Use backend revenue or orders, not platform conversions, when you run your own test.
- Stopping early. Daily results jump around. Looking every day and stopping when the number looks good produces false winners.
- Contamination. Running a promotion, a TV campaign or a price change in only one group breaks the comparison.
- Too small an effect for the data. If the channel is 2% of revenue, a holdout in a few regions will not detect it. Start with your largest channels.
- Leaking ads into the holdout. Check that location exclusions cover all campaigns in the channel, including Performance Max and any campaigns created during the test.
- Over-reading one test. A result describes one channel, in one period, at one spend level. Repeat important tests once a year.
How do you report the result?
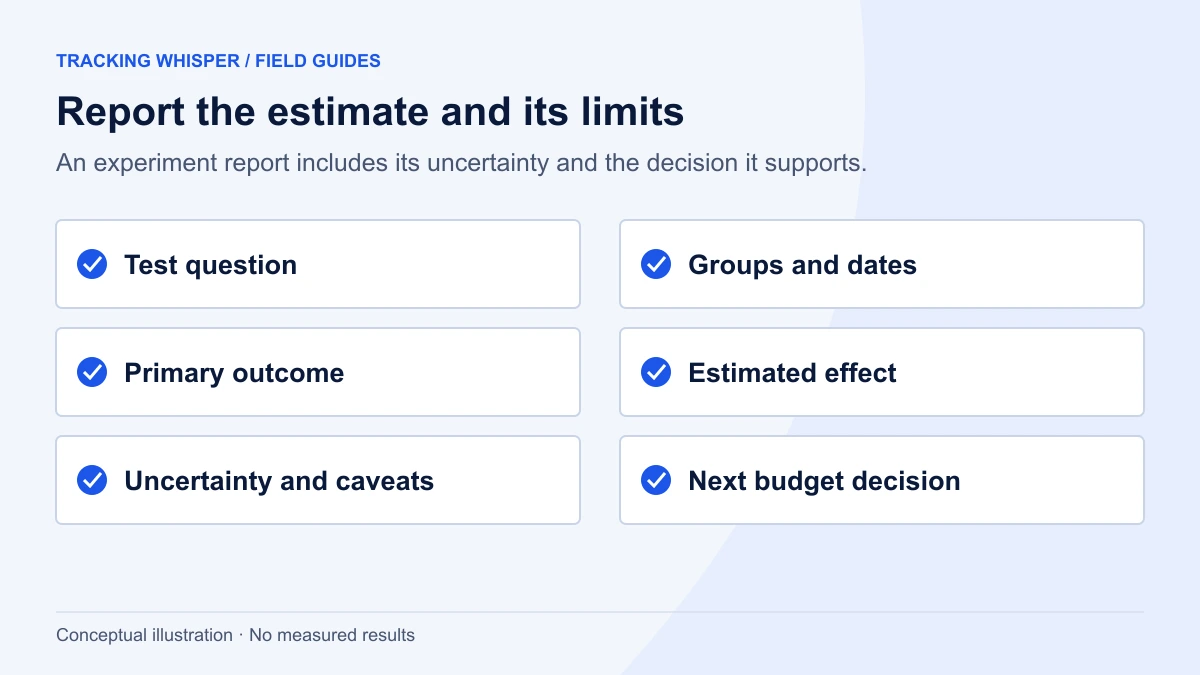
Report three things: the estimated effect, how uncertain it is (the platform's interval, or your placebo check), and what you will do differently. Compare the result with what attribution said. If GA4 or the platform credited the channel with 30% of revenue and the holdout suggests 8%, that gap is the most useful number in the report. It explains why platform figures disagree with each other and with reality, a topic covered in why GA4, Google Ads and Meta never agree.
Key takeaways
- Incrementality tests compare exposed and unexposed groups; attribution cannot tell you what would have happened without the ads.
- Google moved Conversion Lift to a Bayesian method in 2025; user-based studies list a 5,000 USD minimum budget and 1,000 observed conversions.
- Use lift tests, not A/B tests or campaign experiments, to measure incrementality on Google and Meta.
- A geo holdout with backend revenue and a difference-in-differences query is enough for a first test, if you check the pre-period and run a placebo.
- Fix the question, duration and calculation before launch, and read the result once.
- Start with your largest channels and use the results to calibrate your attribution and MMM assumptions.
Tracking Whisper can help with the parts around the test: checking that conversion tracking is stable before and during the test period, and analysing results across Google Ads, Meta, GA4 and BigQuery. See the incrementality glossary entry for definitions.
Frequently asked questions
What is an incrementality test?
An incrementality test compares a group that could see your ads with a comparable group that could not, and measures the difference in conversions or sales. That difference is the effect the ads caused. It answers a different question from attribution, which only assigns credit for conversions that were tracked.
What budget do I need for a Google Ads Conversion Lift study?
Google's help page for user-based Conversion Lift lists a minimum campaign budget of 5,000 USD and at least 1,000 observed conversions in the account. Google moved Conversion Lift to a Bayesian methodology in 2025, which it says works with lower budgets and fewer conversions. Availability can still depend on your account, so check the Lift measurement section in Google Ads or ask your Google contact.
How long should an incrementality test run?
Long enough to cover at least one full purchase cycle, plus the time it takes for ads to show their effect, and never fewer than two full weeks so every weekday is covered at least twice. Avoid periods with major promotions or holidays unless that is what you want to measure. Decide the duration before you start and do not stop early because the numbers look good.
Is a Google Ads experiment the same as an incrementality test?
No. A campaign experiment splits traffic between two versions of a campaign, for example two bid strategies, and tells you which version performs better. Both versions still show ads, so it does not measure what would happen without the ads. Conversion Lift and geo holdouts do.
Can I run a geo test in a small country?
Yes, but with care. You need regions that are large enough to have stable daily sales and that behave similarly over time. In smaller markets, use fewer, larger regions and longer tests, and check in the pre-period that the test and control regions move together before you change anything.
Sources
- Set up Conversion Lift based on users, Google Ads Help
- Set up Conversion Lift based on geography, Google Ads Help
- About Bayesian methodology in Conversion Lift, Google Ads Help
- Strengthen media measurement and ROI clarity with incrementality testing improvements, Google Ads Help
- About A/B Testing, Meta Business Help Centre
- facebookincubator/GeoLift, GitHub
- google/trimmed_match, GitHub
Dimitris builds Tracking Whisper and writes about tracking, analytics and data from the work the agent does every day: GTM containers, GA4 properties, ad platforms and the numbers in between.