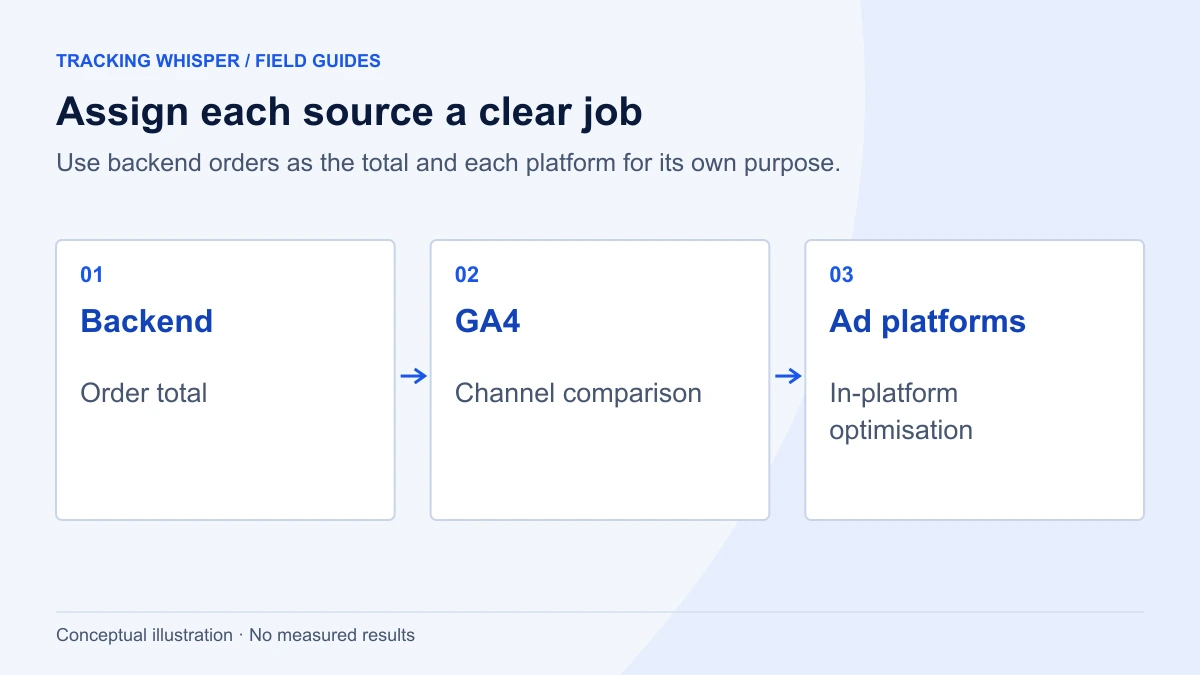
GA4, Google Ads and Meta count the same orders differently because they use different attribution models, lookback windows, reporting dates, interaction types and modelling for users without consent. None of them is wrong, and none of them is the truth: use your backend orders as the total, GA4 for comparing channels on one set of rules, and each ad platform's own numbers for optimising inside that platform.
Every month someone puts three numbers side by side: purchases in GA4, conversions in Google Ads, purchases in Meta Ads Manager. They never match, and the sum of the two ad platforms is often higher than the number of orders the shop actually received. This is not usually a tracking bug. Each tool answers a different question with different rules. Once you know the rules, you can explain the gap, spot when it becomes a real problem, and decide which number to use for what.
Do the three tools even count the same thing?
Not quite. Start with names. In March 2024 GA4 renamed its conversions to key events, and Google now uses "conversion" only for the ads context: an action Google Ads uses to measure and optimise campaigns. A GA4 key event can be imported into Google Ads as a conversion, but Google Ads can also use its own Google tag conversion, which is a separate measurement of the same purchase.
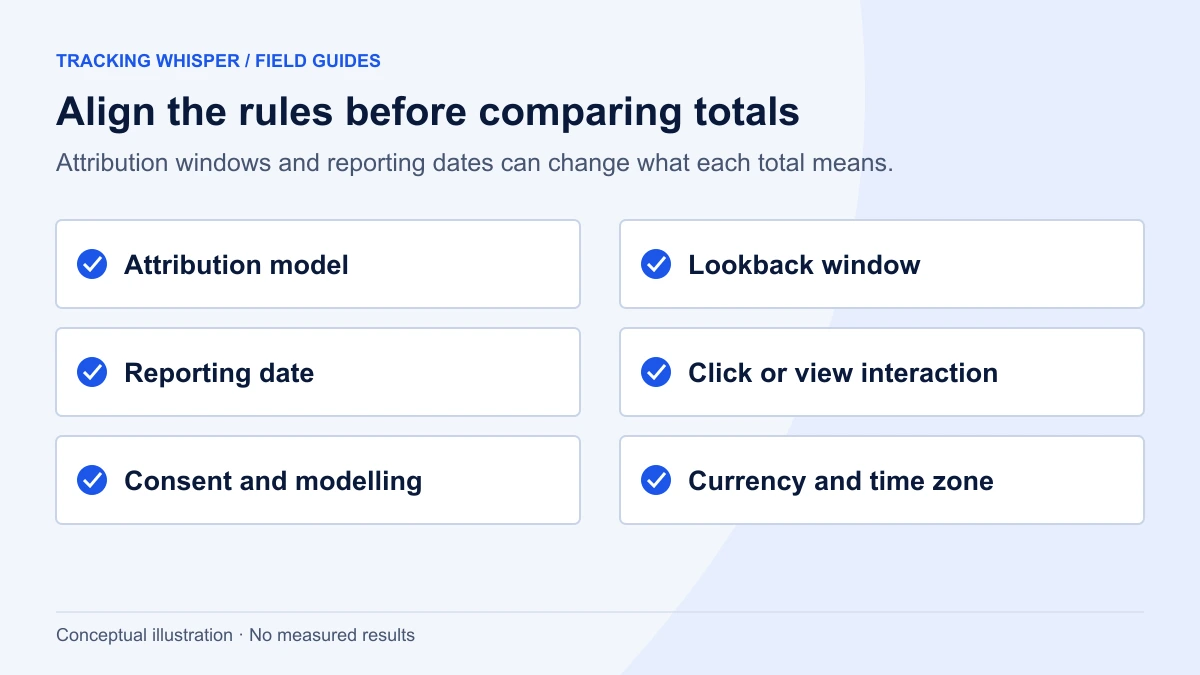
So before comparing anything, write down for each platform:
- Which event or conversion action is being compared (GA4
purchase, the Google Ads "Purchase" action and whether it is imported from GA4 or from the Google Ads tag, Meta'sPurchaseevent from the pixel and Conversions API). - Whether it counts every conversion or one per click. Google Ads lets you choose "Every" or "One" per conversion action, and that applies to imported GA4 conversions as well.
- Which value it uses (with or without tax, shipping and refunds).
Half of all "discrepancies" disappear at this step, because the three numbers were never measuring the same thing.
How do the attribution rules differ?
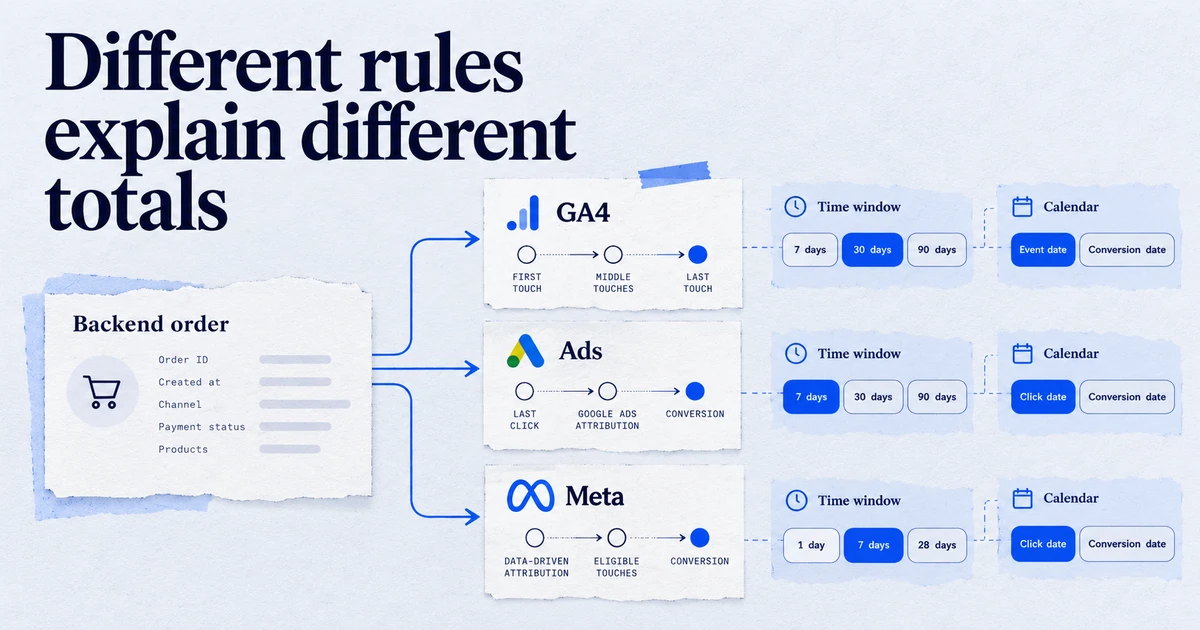
This is the biggest structural reason. Each platform decides which touchpoints may receive credit, over what period.
| GA4 | Google Ads | Meta | |
|---|---|---|---|
| Who competes for credit | All channels the visitor came from | Google ad interactions only | Meta ad interactions only |
| Default model | Data-driven attribution | Data-driven attribution for most conversion actions | Attribution setting on the ad set (click and view windows) |
| Window | Key event lookback: 90 days by default (30 for acquisition events) | Conversion window per action, 1 to 90 days | Click, view and, since March 2026, engage-through windows |
| Views without a click | Not visible | Reported separately as view-through conversions for some campaign types | Counted as view-through |
| Date conversion is reported on | Conversion date | Date of the ad click | Depends on report setting |
GA4 is the only one of the three that sees every channel. If a customer clicks a Meta ad on Monday, a Google Shopping ad on Wednesday and buys on Thursday, Meta claims the order, Google Ads claims the order, and GA4 divides it (with data-driven attribution) or gives it to the last click. That is why the sum of platform numbers routinely exceeds real orders. It is also why a platform's own number answers "did my ads play a part" rather than "how many sales did my ads cause".
GA4's attribution settings allow three models: data-driven, paid and organic last click, and Google paid channels last click. The model you pick changes the key event figures in attribution reports, but session-based reports such as Traffic acquisition still show the session's source. Make sure you compare the same report type every month. Our attribution model glossary entry covers the models in more detail.
Why do the dates not line up?
Google Ads reports a conversion on the date of the click that led to it, not the date of the purchase. GA4 reports it on the day it happened. Google's own example: a click on 19 July and a purchase on 20 July shows up on 19 July in Google Ads and on 20 July in GA4.
On a monthly report, this shifts conversions across month boundaries. On a daily report, it makes yesterday look weak in Google Ads, because conversions from yesterday's clicks are still arriving. Recent days in Google Ads always fill up over time.
On Meta, the Insights API lets you choose whether actions are reported at impression time or conversion time through the action_report_time parameter. With the default mixed setting, off-Meta actions such as website purchases use conversion time. If you pull data through a connector or a reporting tool, check which setting it uses, because a different choice moves conversions between days.
What did Meta change in March 2026?
On 3 March 2026 Meta announced a change to how it classifies ad interactions for website and in-store conversions:
- Click-through attribution now counts link clicks only. Previously, likes, shares, saves and other non-link clicks could count as clicks.
- Those other interactions moved into a renamed column: engaged-view attribution became engage-through attribution.
- The definition of an engaged video view was shortened from 10 seconds to 5 seconds.
Meta's stated reason is to bring click-through reporting closer to third-party tools such as Google Analytics, which only see link clicks. The practical effect is that Meta click-through numbers may drop while the total across click, engage-through and view-through stays similar. If you compare Meta with GA4, compare click-through only, and annotate reports that span March 2026 so nobody reads the reclassification as a performance drop.
How does consent change the numbers?
In the EEA, many visitors decline advertising or analytics cookies. With consent mode, Google tags then do not read or write cookies, and Google Ads fills part of the gap with conversion modelling: it uses consented journeys to estimate conversions from unconsented ones, and includes those modelled conversions in campaign reports at the same granularity as observed ones. Google notes that consented users are typically 2 to 5 times more likely to convert than unconsented users, which is why the models do not simply scale up.
GA4 can model behaviour for users who declined analytics cookies, but only with an advanced consent mode setup and enough data: Google's threshold includes at least 1,000 events per day with analytics_storage denied for at least 7 days. Behavioural modelling is not included in the BigQuery export. Meta uses its own methods and does not see Google's modelling at all.
The result: three tools apply three different corrections to the same missing data. In markets with low consent rates, expect wider gaps. If your consent setup is incomplete, the gaps will be wider still and harder to explain.
What other technical causes are there?
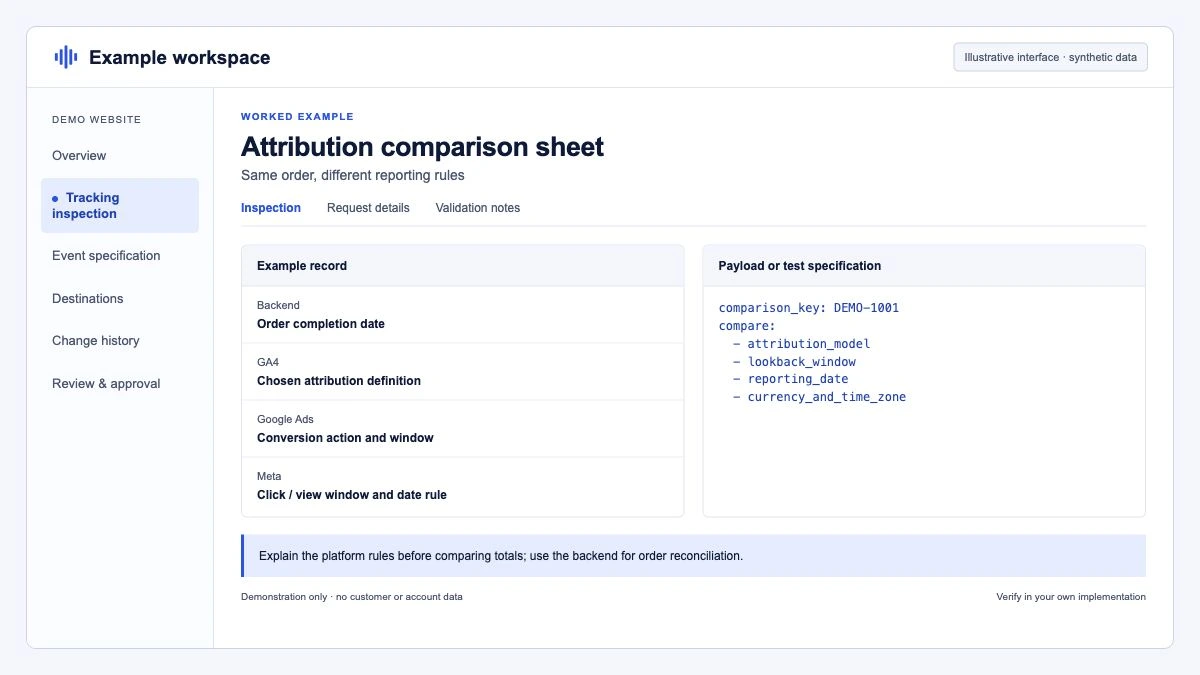
Once attribution, dates and consent are accounted for, the remaining causes are usually technical:
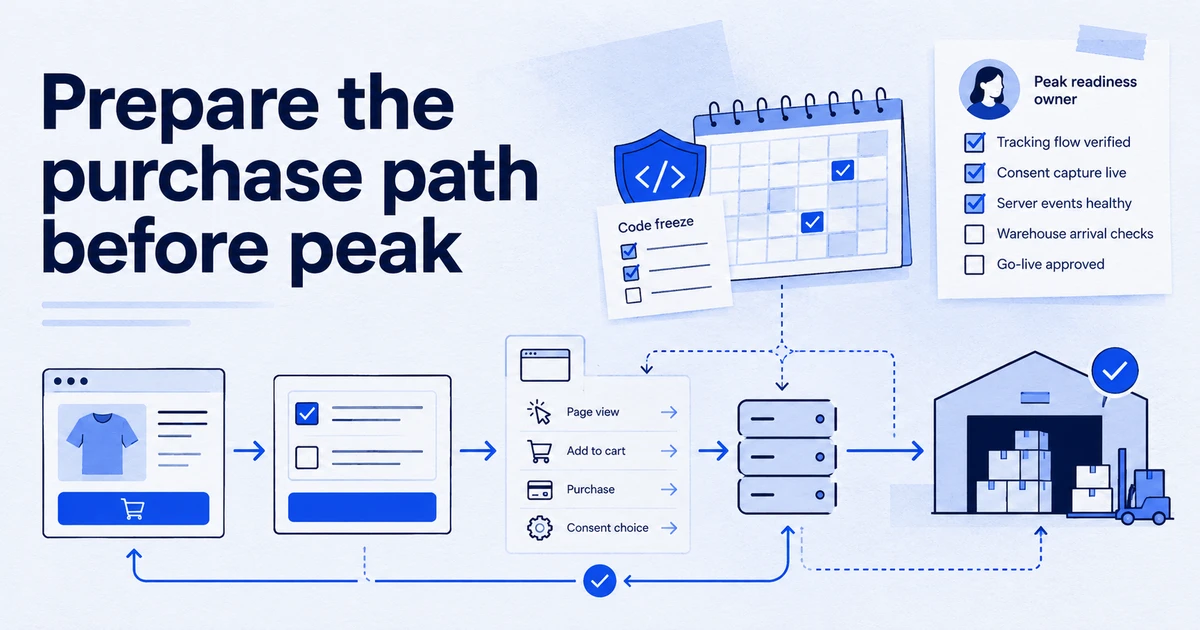
- Different tags. The GA4 purchase tag, the Google Ads conversion tag and the Meta pixel may fire on different triggers. One fires on the thank-you page, another on a dataLayer event, and a reload counts twice in one tool but not another.
- Duplicates. GA4 deduplicates purchases with the same
transaction_idon web streams. Meta deduplicates pixel and Conversions API events only whenevent_idand event name match. If either is missing, one tool double-counts. See duplicate purchase events in GA4 and Meta deduplication. - Invalid clicks. Google Ads filters clicks it considers invalid, so conversions from those clicks can appear in GA4 but not in imported Google Ads conversions.
- Cross-device and logged-in users. Ad platforms with logged-in users can link a phone ad view to a desktop purchase. GA4 without User-ID cannot.
- Lost click identifiers. Payment redirects, consent banners or URL rewrites that drop
gclidor UTM parameters push revenue into direct or unassigned in GA4, while the ad platform still claims it. - Refunds. The backend removes refunded orders. Ad platforms keep the original conversion unless you send them a refund or adjustment.
How do you reconcile them in practice?
Do not try to force the numbers to match. Reconcile them in layers instead:
- Backend first. Take orders and revenue from the shop or CRM for the period. This is the total.
- GA4 against backend. Compare GA4 purchases and revenue to the backend by day. The ratio is your tracking coverage. It will not be 100%, but it should be stable.
- GA4 by channel. Use one GA4 attribution model to split the backend total across channels.
- Platform numbers as their own view. Report Google Ads and Meta conversions in separate columns, labelled with their attribution setting.
- Investigate changes, not gaps. A sudden drop in coverage from one week to the next is a tracking problem. A stable gap is a definition.
If you export GA4 to BigQuery, the coverage check is one query. Replace the backend table with your own orders table.
WITH ga4 AS (
  SELECT
    PARSE_DATE('%Y%m%d', event_date) AS day,
    COUNT(DISTINCT ecommerce.transaction_id) AS ga4_orders,
    SUM(ecommerce.purchase_revenue) AS ga4_revenue
  FROM `your-project.analytics_123456789.events_*`
  WHERE event_name = 'purchase'
    AND _TABLE_SUFFIX BETWEEN '20260901' AND '20260930'
  GROUP BY day
),
backend AS (
  SELECT
    DATE(created_at) AS day,
    COUNT(*) AS backend_orders,
    SUM(net_revenue) AS backend_revenue
  FROM `your-project.shop.orders`
  WHERE DATE(created_at) BETWEEN '2026-09-01' AND '2026-09-30'
    AND status != 'cancelled'
  GROUP BY day
)
SELECT
  b.day,
  b.backend_orders,
  g.ga4_orders,
  ROUND(SAFE_DIVIDE(g.ga4_orders, b.backend_orders), 3) AS order_coverage,
  ROUND(SAFE_DIVIDE(g.ga4_revenue, b.backend_revenue), 3) AS revenue_coverage
FROM backend b
LEFT JOIN ga4 g USING (day)
ORDER BY b.day;
Make sure the timezones match: the GA4 export uses the property's reporting timezone for event_date, and your orders table may store UTC.
So which number should you trust?
It depends on the question.
| Question | Use |
|---|---|
| How much did we sell? | Backend or shop system |
| Which channels brought the sales, on one set of rules? | GA4 with a fixed attribution model |
| Which campaigns, ad groups or ads to scale inside Google Ads? | Google Ads conversions |
| Which ad sets and creatives to scale inside Meta? | Meta conversions, click-through first |
| Did the ads cause sales that would not have happened anyway? | None of the above: an incrementality test |
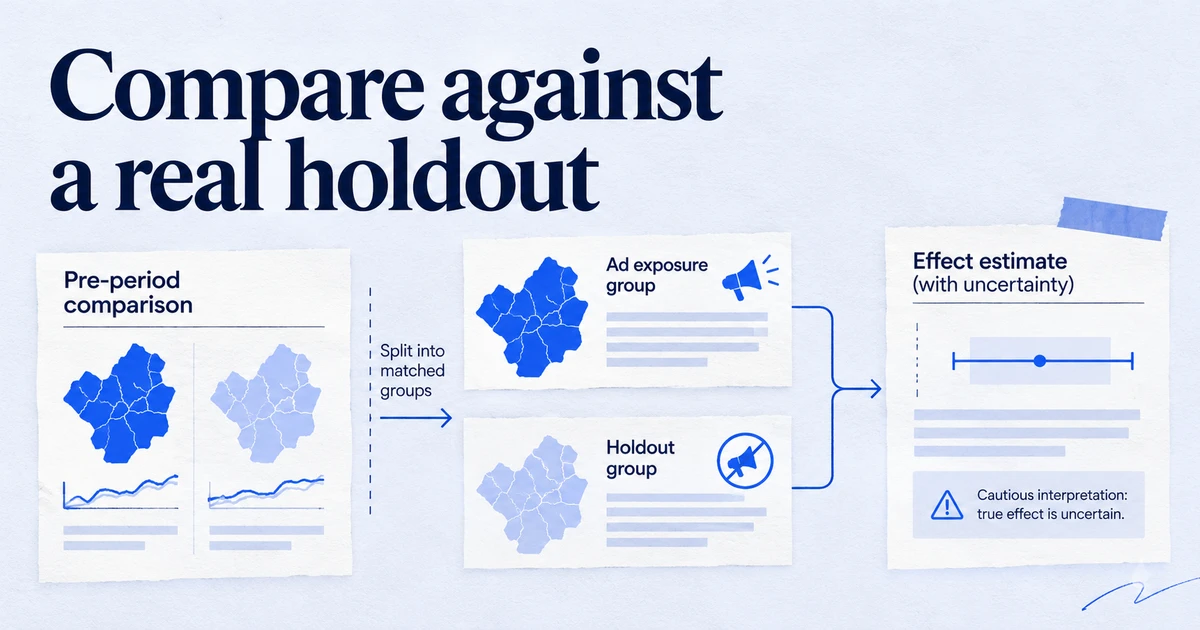
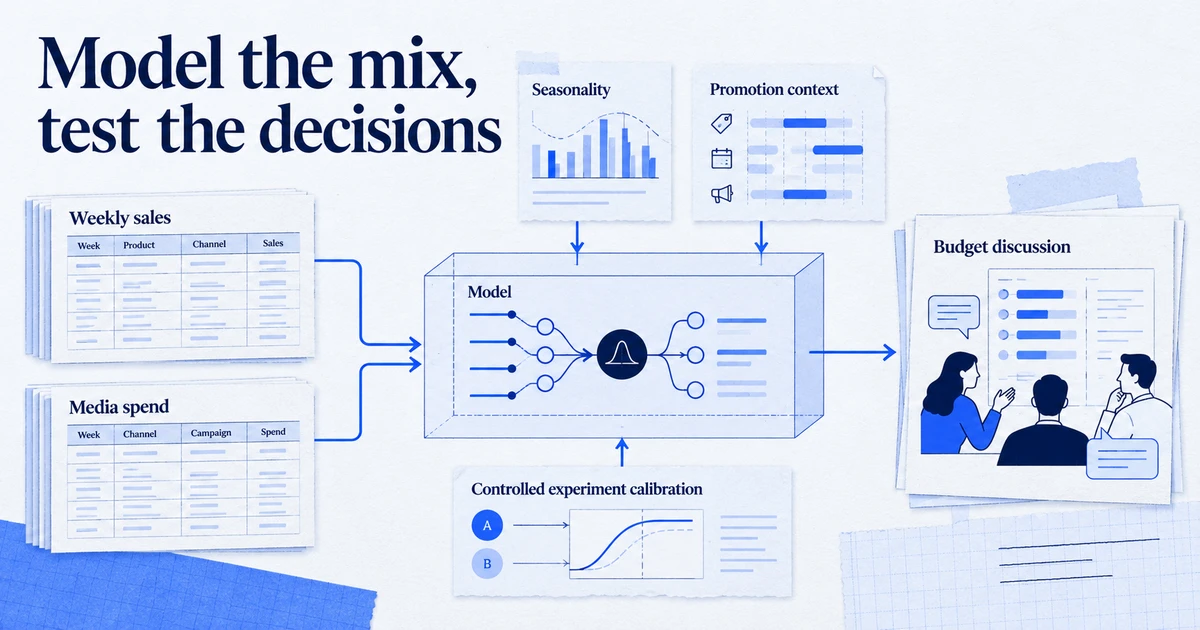
The last row matters most. All three tools measure correlation with ad exposure, under their own rules. None of them can tell you what would have happened without the ads. When budgets are large enough for that question to matter, use holdout or geo experiments rather than arguing about which dashboard is right.
Key takeaways
- GA4 shares credit across all channels; Google Ads and Meta each claim conversions their own ads touched, so platform numbers usually add up to more than real orders.
- Google Ads reports conversions on the click date and GA4 on the conversion date, which moves numbers between days and months.
- Since March 2026, Meta click-through counts link clicks only, and other interactions sit in engage-through; compare click-through with GA4.
- Consent mode modelling, view-through, cross-device matching and duplicates each widen the gaps in different directions.
- Use the backend for totals, GA4 for channel split, platforms for in-platform optimisation, and experiments for causality.
- Track the ratio between GA4 and backend over time: a change in the gap signals a tracking problem.
Tracking Whisper connects to GA4, Google Ads, Meta and BigQuery, so it can put these numbers side by side with their attribution settings and flag when the gap between them shifts. More on that on the analysis page.
Frequently asked questions
Why does Google Ads show more conversions than GA4?
Google Ads gives each Google ad click credit for conversions within its conversion window, includes modelled conversions for users who declined cookies, and can count conversions across devices. GA4 shares credit across all channels, so other channels take part of the credit. Google Ads also reports conversions on the click date, while GA4 uses the conversion date.
Why does Meta report more purchases than GA4?
Meta counts view-through conversions after someone saw an ad without clicking, which GA4 cannot observe at all. Since March 2026 Meta also reports engage-through conversions after likes, shares, saves or video views. GA4 only credits Meta when a visit arrives with Meta's UTM parameters or referrer, and only if Meta wins the attribution.
Which number should I report to a client?
Report total orders and revenue from the backend or shop system, because that is what the business actually took. Use GA4 to split that total by channel on one consistent set of rules. Show platform-reported numbers separately and label them as the platform's own view.
How big a gap between GA4 and the backend is normal?
Google publishes no fixed acceptable percentage, and the gap depends on consent rates, ad blockers and payment flows. Measure your own baseline over a few stable weeks, then alert when the gap moves away from it. A sudden change matters more than the absolute size.
Do the March 2026 Meta attribution changes affect my numbers?
Yes, in reporting. Meta changed click-through attribution for website and in-store conversions to count link clicks only and moved other interactions such as likes, shares and saves into engage-through attribution. Click-through numbers may look lower, while the total across columns can stay similar.
Sources
- Data discrepancies: Factors and troubleshooting, Google Ads Help
- [GA4] Select attribution settings, Analytics Help
- Conversions vs. key events in Google Analytics, Analytics Help
- About consent mode modeling, Google Ads Help
- Simplifying Ad Measurement for a Social-First World, Meta for Business
- About Attribution Models and Attribution Settings, Meta Business Help Centre
- Insights API, Meta for Developers
Dimitris builds Tracking Whisper and writes about tracking, analytics and data from the work the agent does every day: GTM containers, GA4 properties, ad platforms and the numbers in between.